Options Expected Move shows the price range that the options market is pricing for the selected expiration.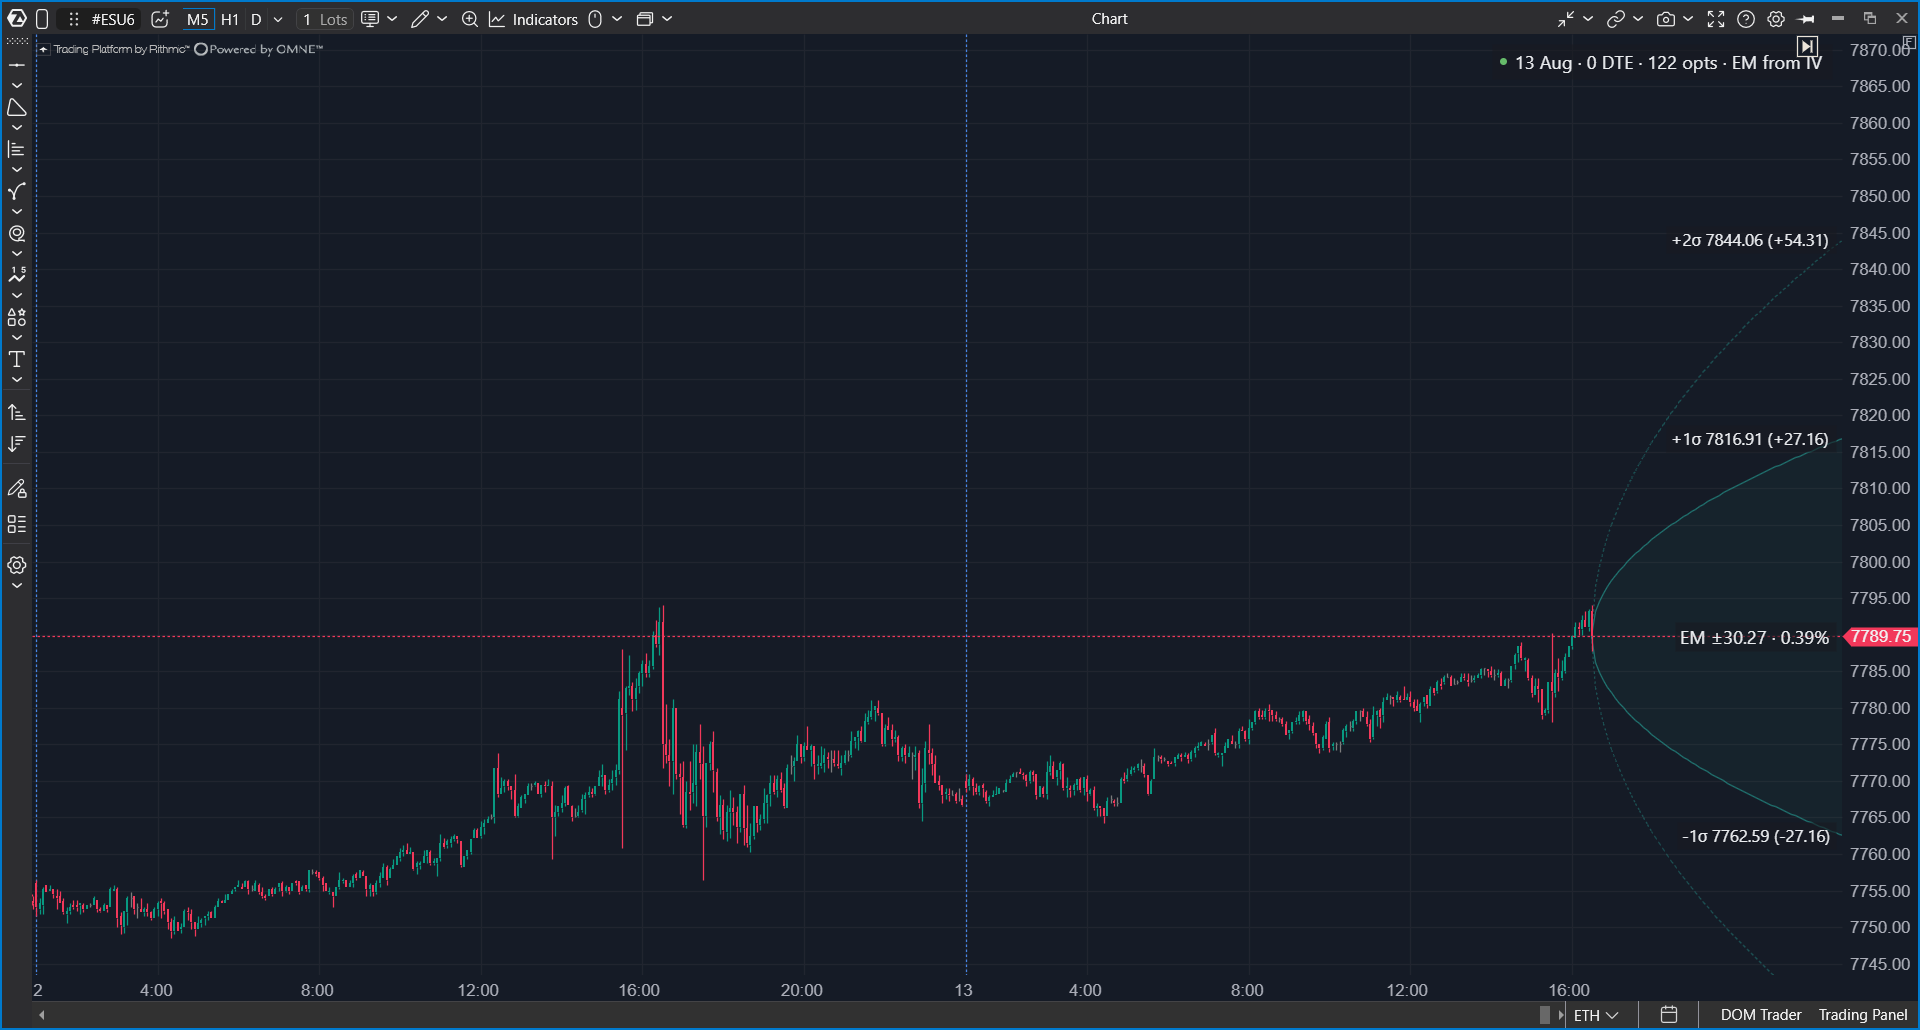
The indicator helps estimate whether a potential target is inside or outside the movement range implied by current options prices.
Before you start
Make sure that your connected data provider supports options and provides options data for the selected underlying instrument. Data availability depends on the provider, account permissions, instrument, and market data subscription. Options data can be available through Interactive Brokers or Rithmic, depending on your setup.
How option analytics indicators work
Option analytics indicators subscribe to a range of option strikes around the current underlying price for the selected expiration series. ATAS receives live market data such as bid, ask, last price, open interest, and day volume.
Values such as implied volatility and Greeks are calculated in ATAS from the available option prices. The indicators then aggregate the data by strike, expiration, side, or time interval and display the result on the chart.
What Options Expected Move shows
The indicator draws an expanding cone or a corridor around the current price. The inner boundaries usually represent approximately one standard deviation, and the outer boundaries represent a wider two-standard-deviation range.
The expiration moment is marked on the chart. At that point, the cone reaches its full expected move size.
In standard probability terms, one standard deviation covers about 68% of expected outcomes, while two standard deviations cover about 95%. In the Options Expected Move indicator, this means that the inner boundaries show the range where the options market expects the underlying price to remain with roughly 68% probability, and the outer boundaries show a wider range with roughly 95% probability.
For example, if the label shows EM ±42.50 · 0.74%, the market is pricing an expected move of about 42.50 points in either direction by the selected expiration. A move beyond the one-standard-deviation boundary can be considered stronger than the market’s usual expected range, while a move beyond the two-standard-deviation boundary is statistically more extreme.
Why it is useful
Expected Move is based on what market participants are paying for in option prices. It helps estimate whether a potential target is inside or outside the movement range implied by the options market.
It can also help evaluate whether a move is already large relative to the market's priced expectations.
How it works
The indicator derives implied volatility from live option quotes around the current price and calculates the expected move for the remaining time until expiration. If implied volatility is not available, the indicator can use a fallback calculation based on the ATM straddle price.
The cone expands with time because price uncertainty grows as expiration gets farther away. For 0DTE options, the cone is usually more compact and changes during the session as time to expiration decreases.
Common Data settings
| Setting | Description |
|---|---|
| Expiration | Selects which expiration series is analyzed. Auto (nearest) uses the nearest available expiration and switches to the next series after expiration. |
| Strikes per side | Defines how many strikes above and below the current price are included in the calculation. |
Settings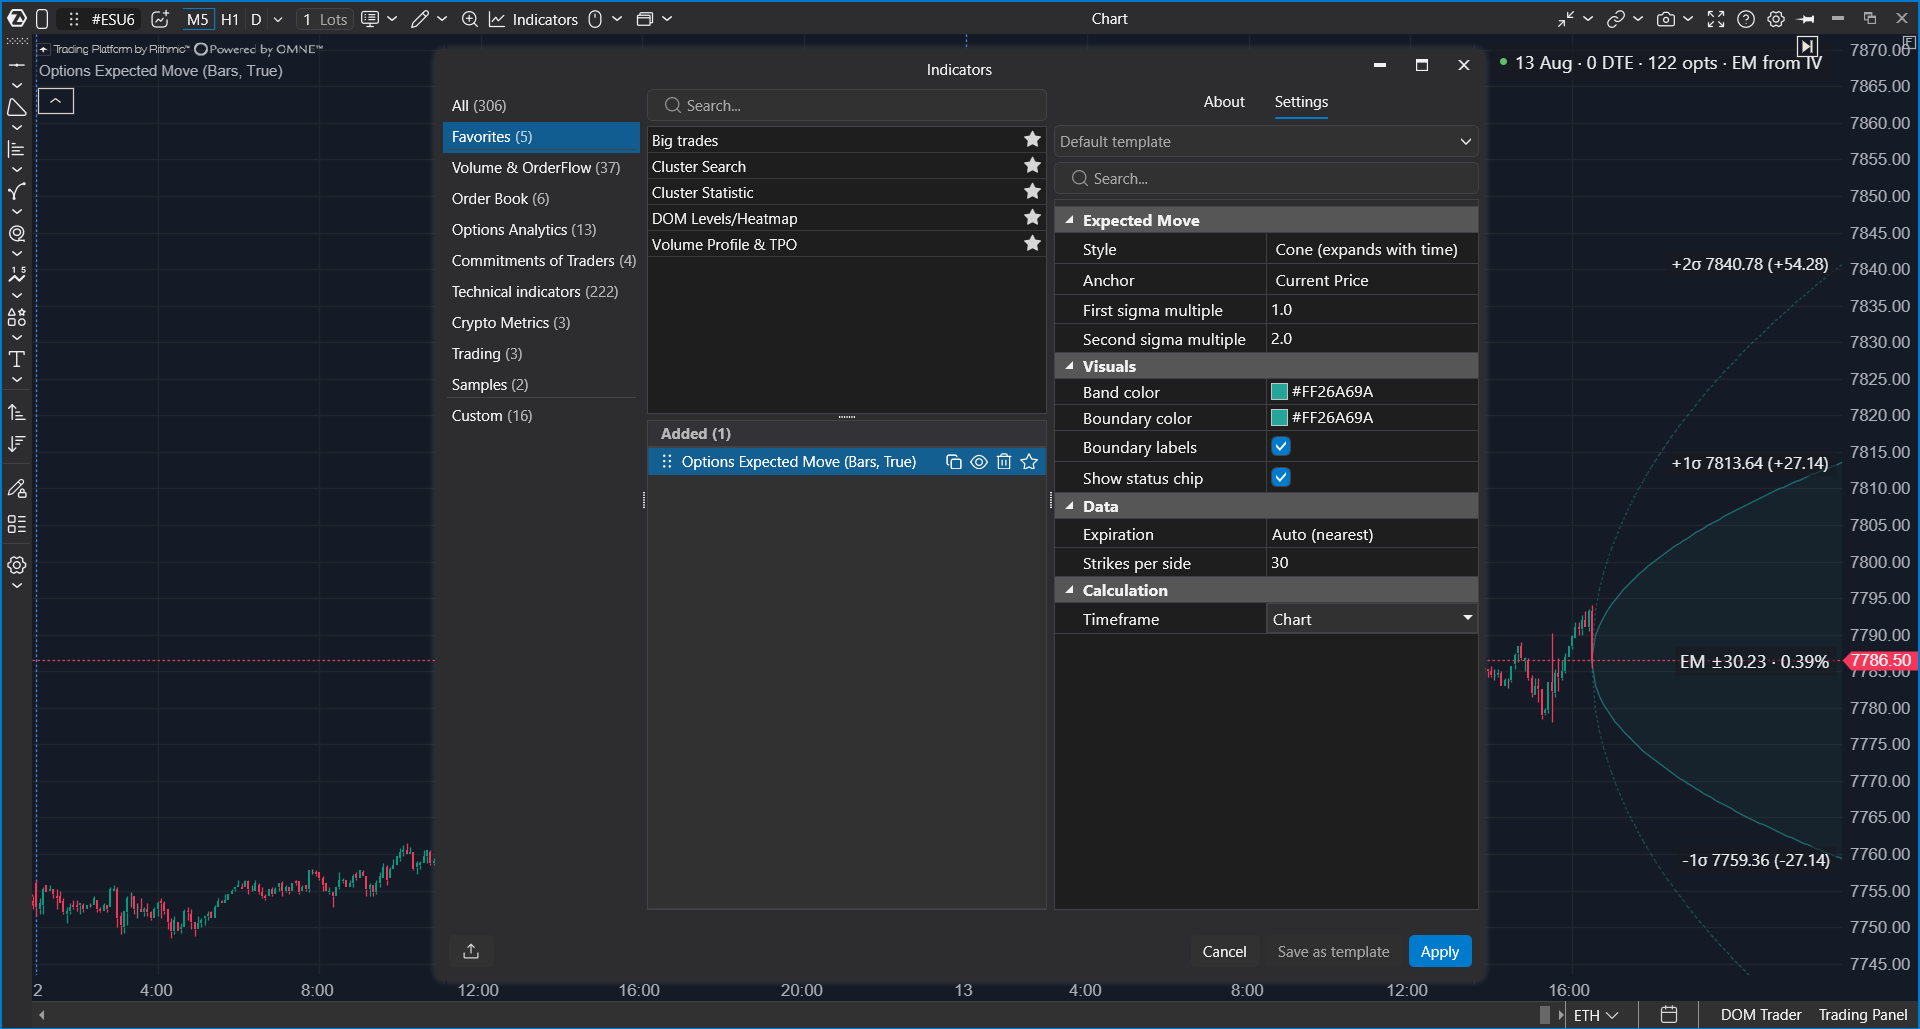
| Group | Setting | Description |
|---|---|---|
| Data | Expiration, Strikes per side | Defines the analyzed expiration and strike range. |
| Expected Move | Style | Cone draws an expanding expected move range. Corridor draws a flat range for the full expected move. |
| Expected Move | Anchor | Current Price follows the current price. Attachment Price keeps the range anchored to the price at the moment the indicator was added. |
| Expected Move | First sigma multiple, Second sigma multiple | Control the inner and outer boundary multipliers. |
| Visuals | Band color, boundary color, labels | Controls the color of the expected move area, boundary lines, and boundary labels. |
Status chip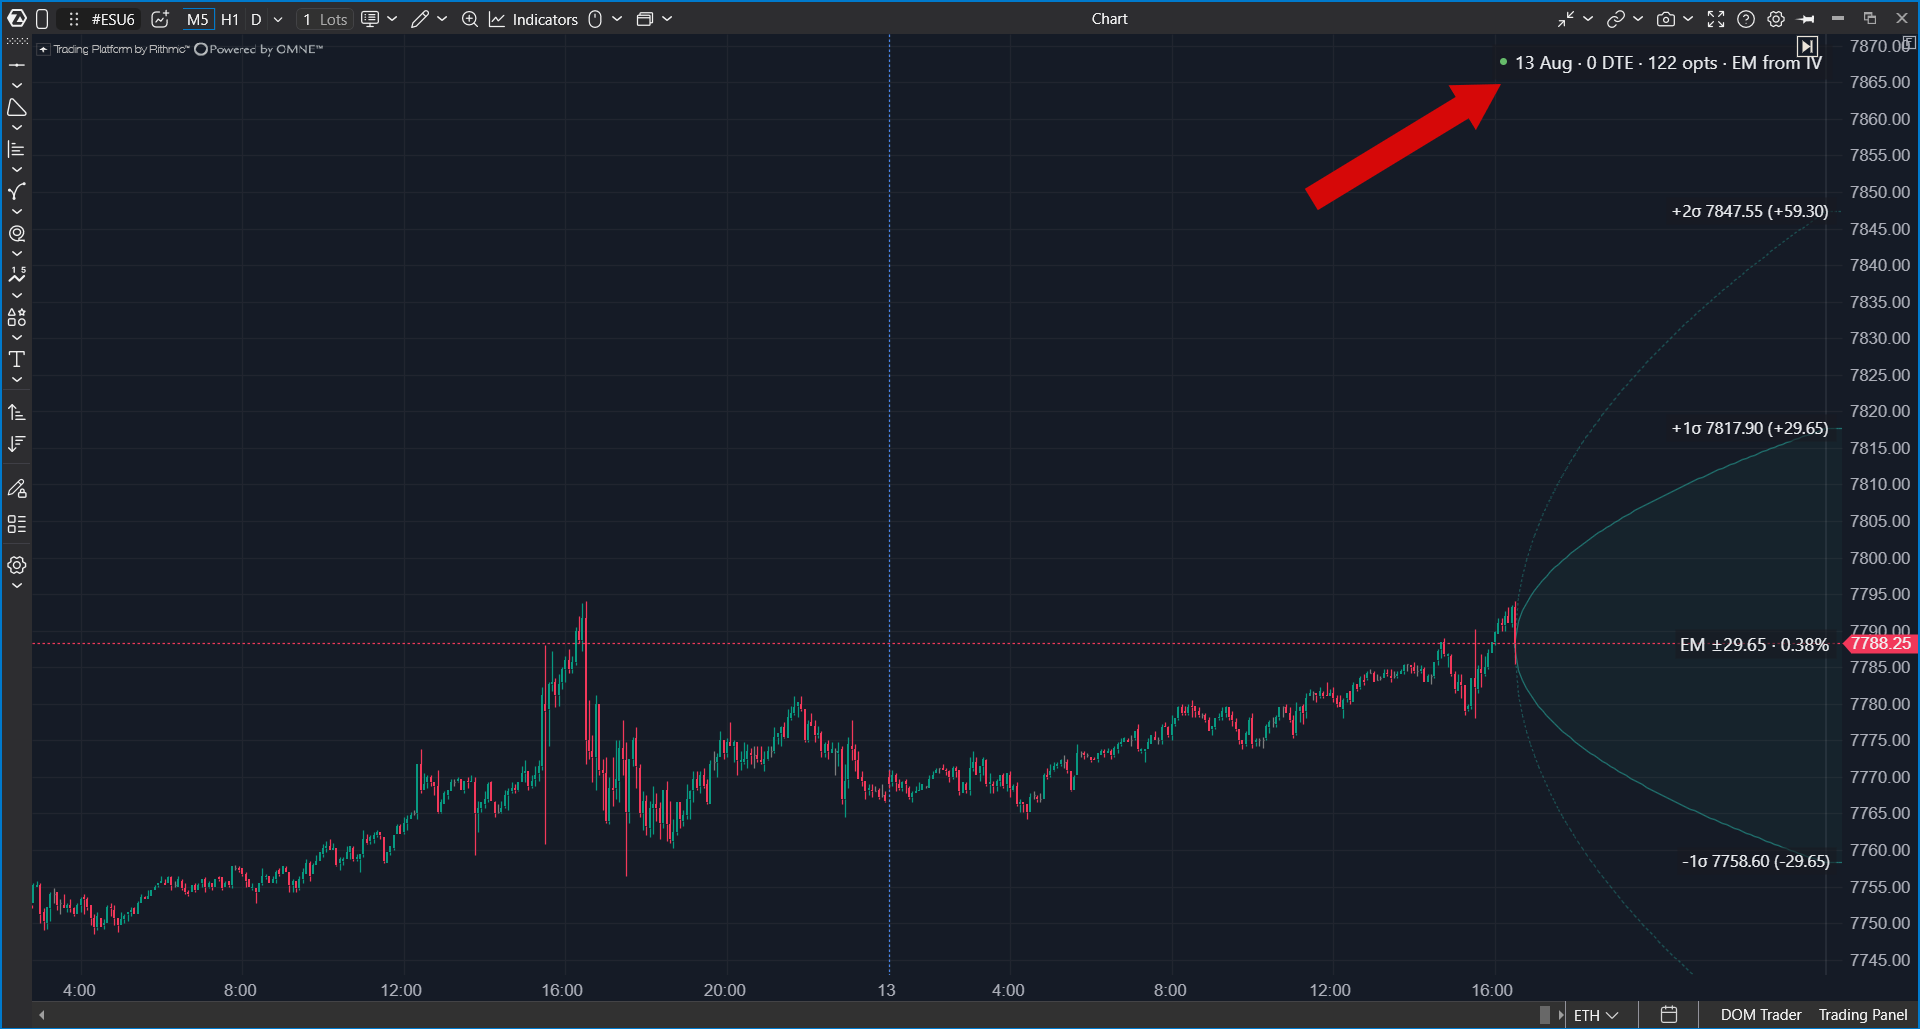
The status chip shows the selected expiration, days to expiration, and the number of subscribed option contracts. It can also show whether the value was calculated from implied volatility or from the straddle fallback.
Practical recommendations
- Use Expected Move to compare a trade idea, target, or recent movement with the range implied by options prices.
- Use Cone when you want the range to expand toward expiration. Use Corridor when you want a flat full-range reference.
- Use Current Price when you want the range to follow the market. Use Attachment Price when you want to keep the initial reference fixed.
- For 0DTE analysis, watch how the range changes during the session as time to expiration decreases.
- Daily expected move values from external services can be wider because they may refer to a full trading day, while the chart cone reflects the remaining time to expiration.
Frequently asked questions
Why does the indicator need time to warm up?
The indicator has to subscribe to multiple option contracts and collect enough quotes for the selected strike and expiration range.
Why do values differ from other services?
Different tools may use different data sources, expiration filters, strike ranges, implied volatility methods, or time-to-expiration assumptions.
What should I check if the indicator shows no data?
Check that your connection provides options data for the selected underlying instrument, that the required market data subscription is active, and that the selected expiration range contains available option contracts.
Was this article helpful?
That’s Great!
Thank you for your feedback
Sorry! We couldn't be helpful
Thank you for your feedback
Feedback sent
We appreciate your effort and will try to fix the article