Option analytics indicators in ATAS bring options market context directly to the chart of the underlying instrument. They help you see where large options positions are concentrated, which price levels may matter, what movement the options market is pricing in, and what type of price behavior may be expected around key strikes.
You do not need to open or trade options to use these indicators. Add the required indicator to a chart and make sure your connected data provider supplies options data for the selected instrument.
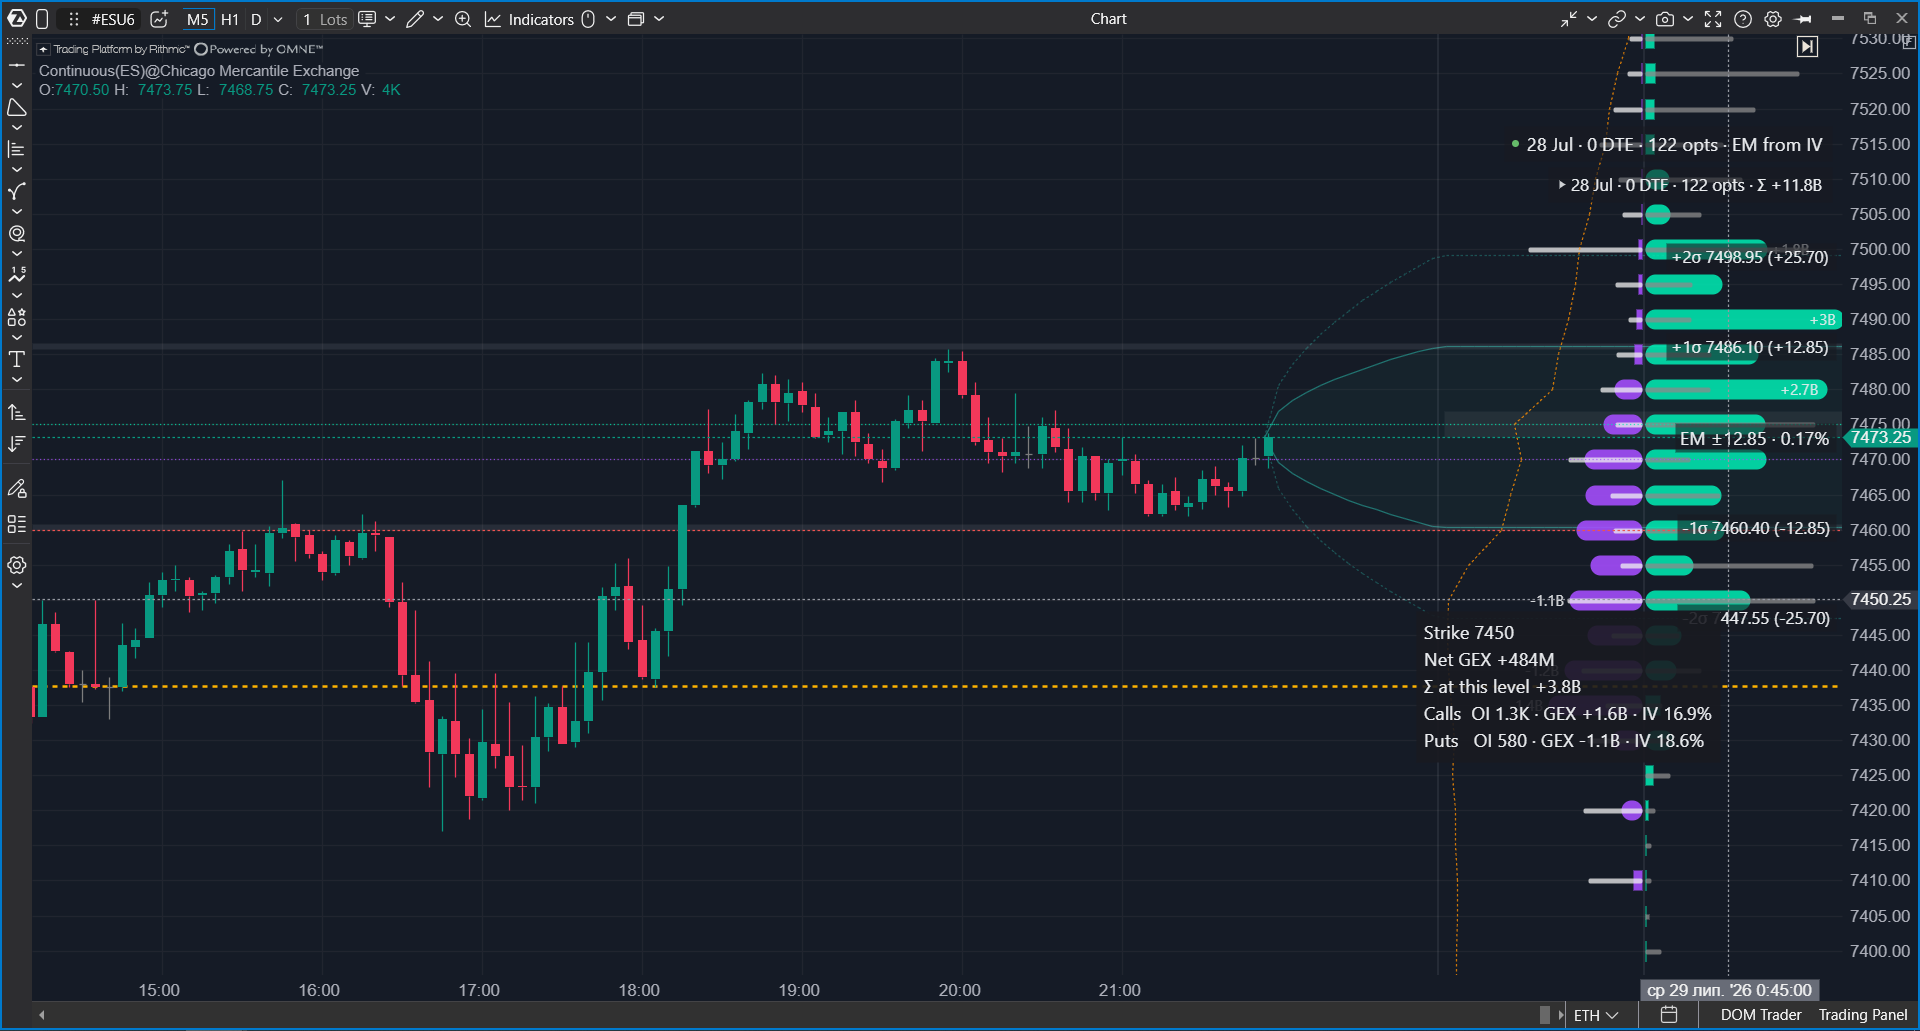
Before you start
Before using option analytics indicators, make sure that your connected data provider supports options and provides options data for the selected underlying instrument.
Options data availability depends on the provider, account permissions, instrument, and market data subscription. For example, options data can be available through Interactive Brokers or Rithmic, depending on your setup.
How option analytics indicators work
The indicators subscribe to a range of option strikes around the current underlying price for the selected expiration series. For each option contract, ATAS receives live market data such as bid, ask, last price, open interest, and day volume.
Values such as implied volatility and Greeks are calculated in ATAS from the available option prices. The indicators then aggregate the data by strike, expiration, side, or time interval and display the result on the chart.
All indicators in the package use the same calculation principles, so related levels and values are consistent across the indicators.
Common Data settings
| Setting | Description |
|---|---|
| Expiration | Selects which expiration series is analyzed. Auto (nearest) uses the nearest available expiration and switches to the next series after expiration. You can also select a specific expiration date. |
| Aggregate nearest series | Combines the nearest expiration series into one view. This is useful when you want to see the combined position across weekly and monthly options. This setting is available for indicators that support series aggregation. |
| Strikes per side | Defines how many strikes above and below the current price are included in the calculation. A larger value gives a wider market picture, but may take longer to load and update. |
| Wide range (sparse) | Uses a wider strike range when several expiration series share the available quote budget. The indicator may skip some intermediate strikes, so strike-by-strike detail becomes approximate. |
Status chip
Each indicator can show a compact status chip in the chart corner. If several option indicators are placed on the same side of the chart, their chips are stacked vertically.
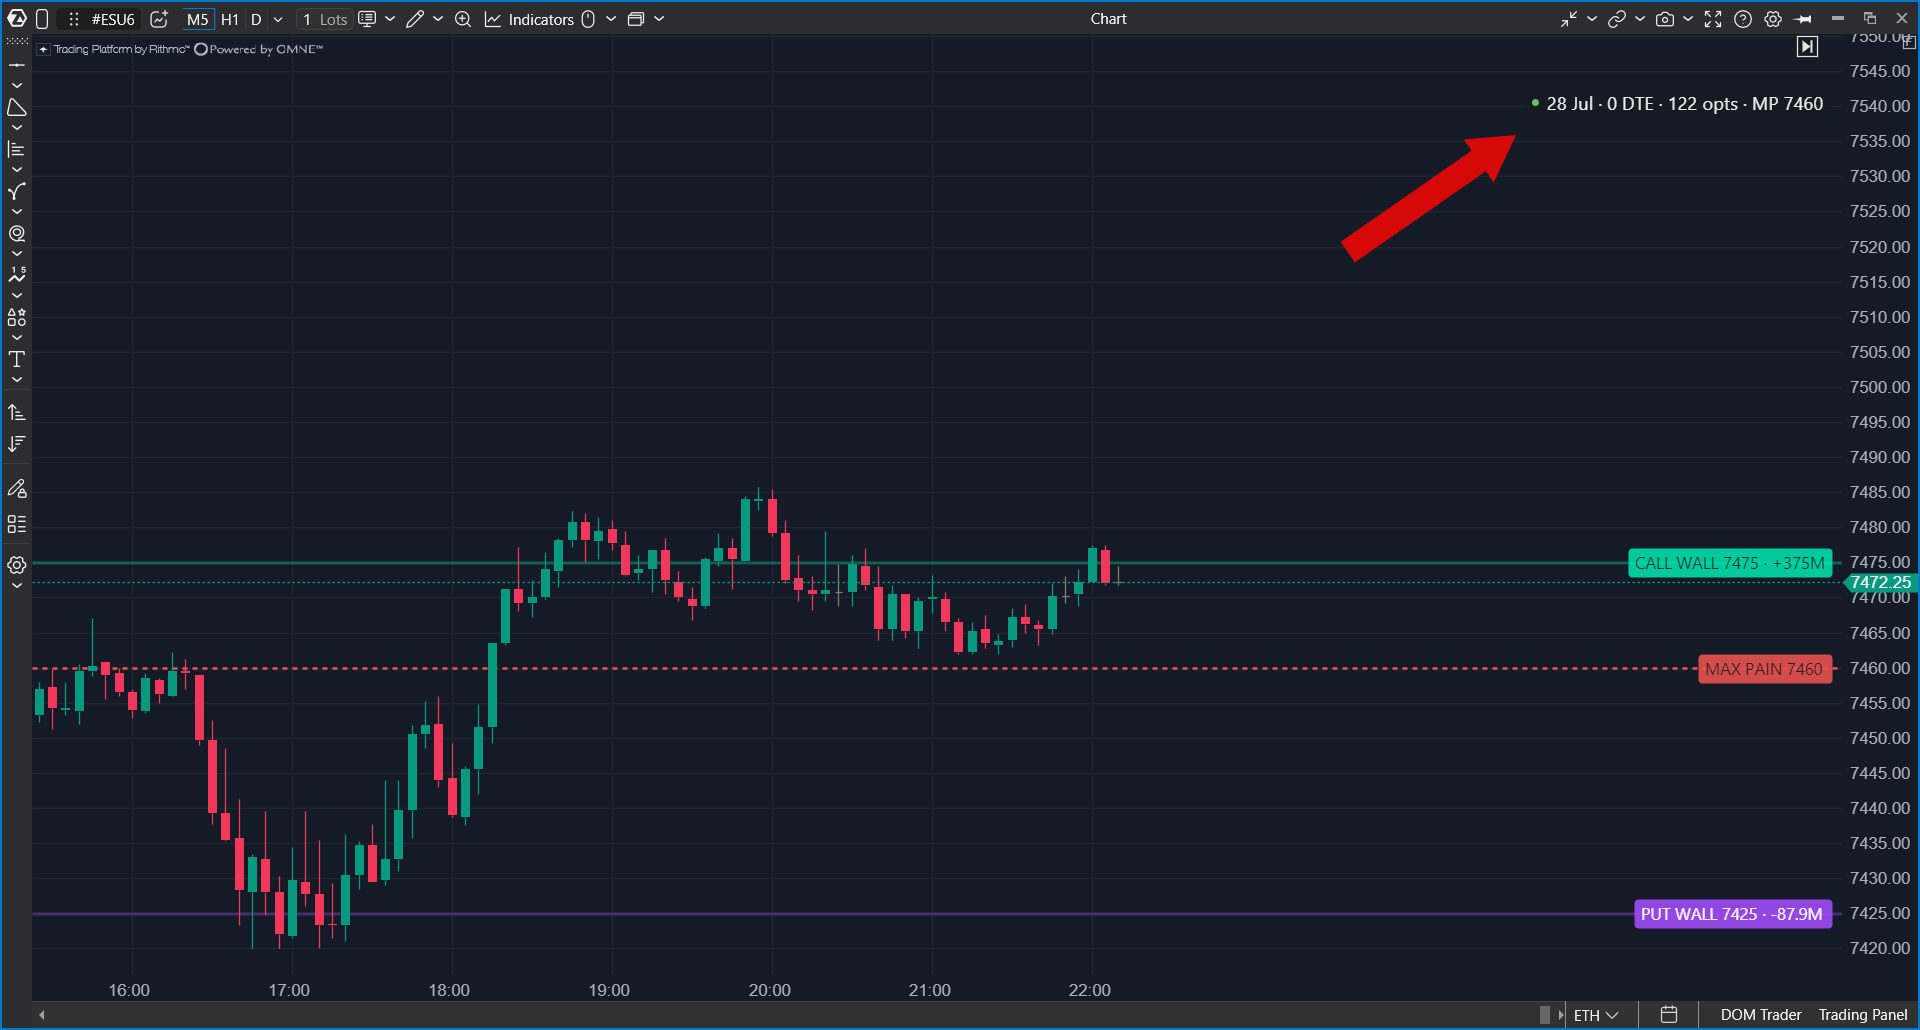
| Status example | Meaning |
|---|---|
| 28 Jul · 1 DTE · 238 opts | The indicator is working. The chip shows the expiration, days to expiration, and number of subscribed option contracts. |
| warming 12/238 | The indicator is collecting quotes and has not yet received enough data for all subscribed contracts. |
| Waiting for options connection | No options-capable connection is currently available. If the connection is interrupted, the last picture may remain on the chart and update again after reconnection. |
| ±19 strikes (3 series share the quote budget) | The strike window was reduced because several expiration series share the available quote budget. Check the Strikes per side and Wide range settings. |
Options OI Profile
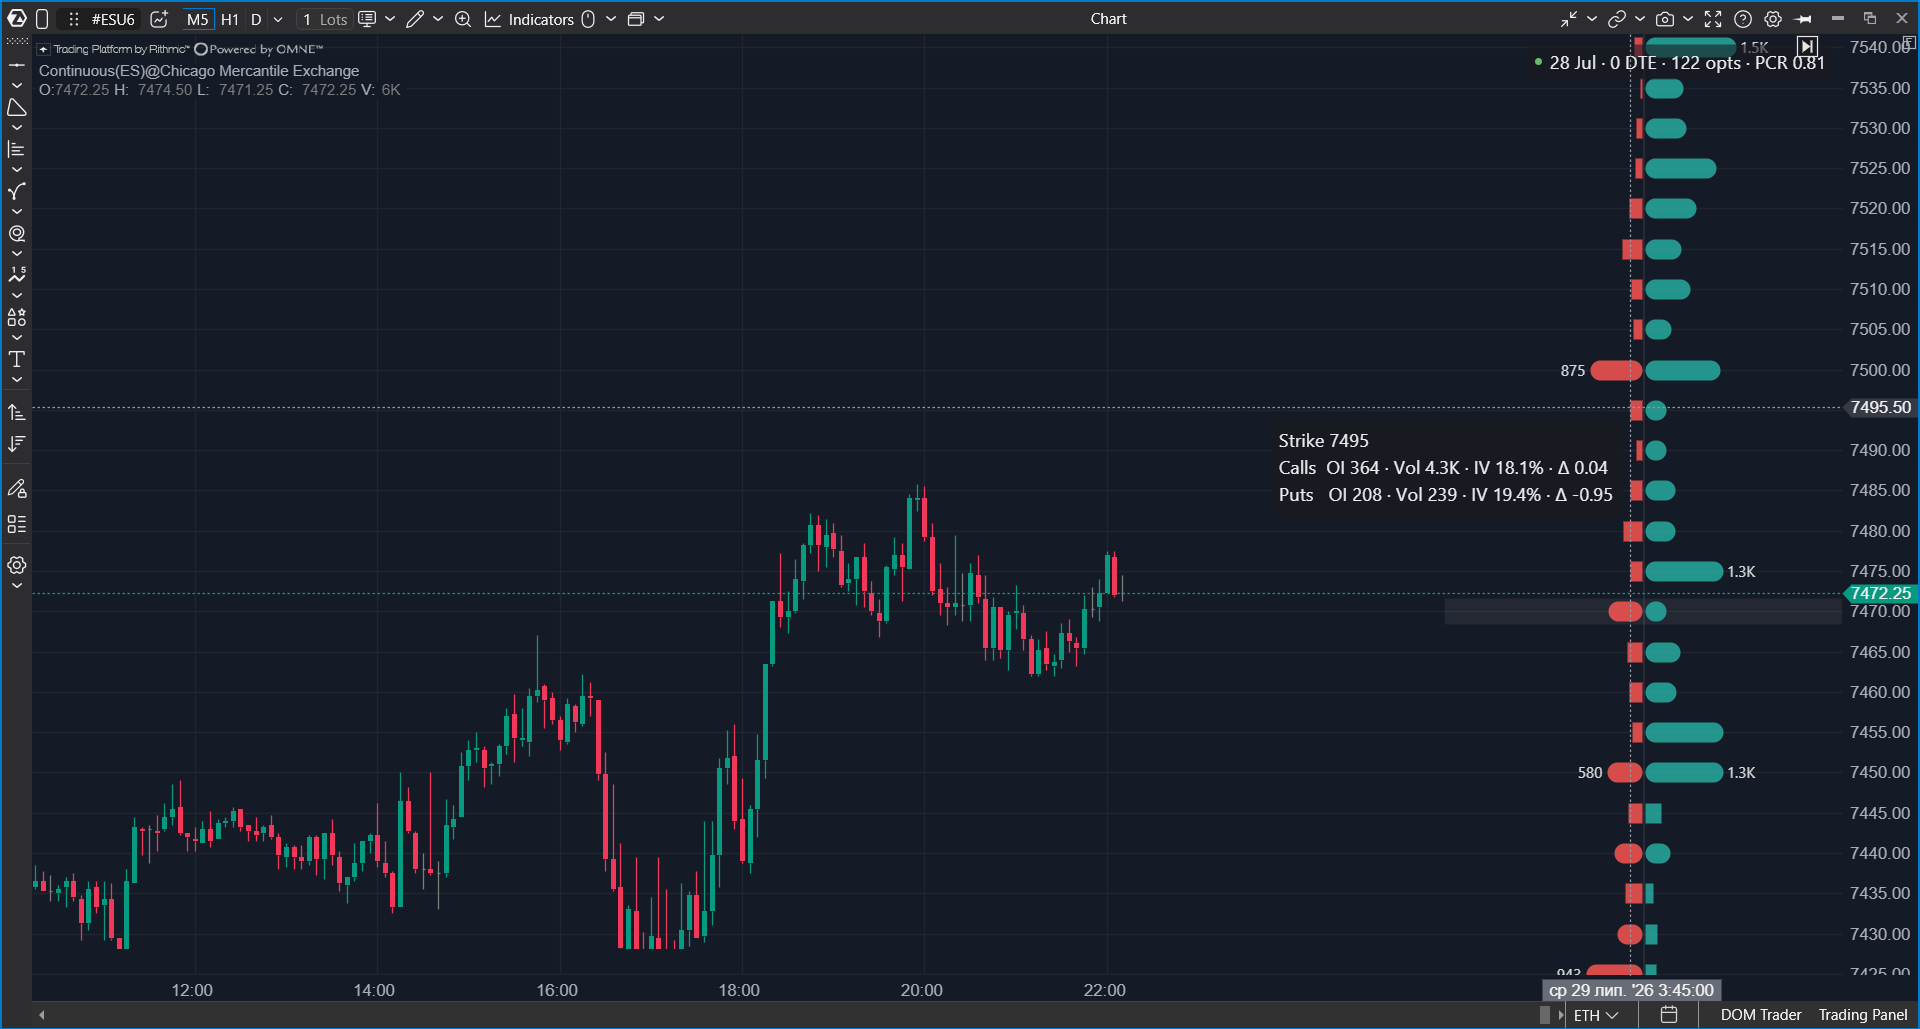
Options OI Profile displays open interest by strike as a profile on the chart. In the mirrored view, call bars are shown on one side of the axis and put bars on the other side. The longer the bar, the larger the open interest at that strike.
Why it is useful
Large clusters of open interest show where significant options positions are concentrated. These areas can become important market zones because many participants have exposure around the same strikes.
A large put open interest area below the current price can highlight a zone of protection or potential support. A large call open interest area above the current price can highlight a potential resistance area.
How it works
The indicator listens to the selected option series and sums open interest or day volume by strike and option side. The values come from the options data feed; the profile itself does not require model assumptions.
When you hover over a bar, the tooltip shows detailed information for that strike, such as open interest, volume, volatility, and delta for calls and puts.
Modes
- Open Interest shows accumulated positions.
- Day Volume shows where options are traded during the current session. This mode is especially useful for 0DTE analysis.
- Net OI (Call - Put) shows the difference between call and put open interest at each strike.
The status chip can also show the put/call ratio for the selected source. A value above 1 means puts dominate; a value below 1 means calls dominate.
Settings
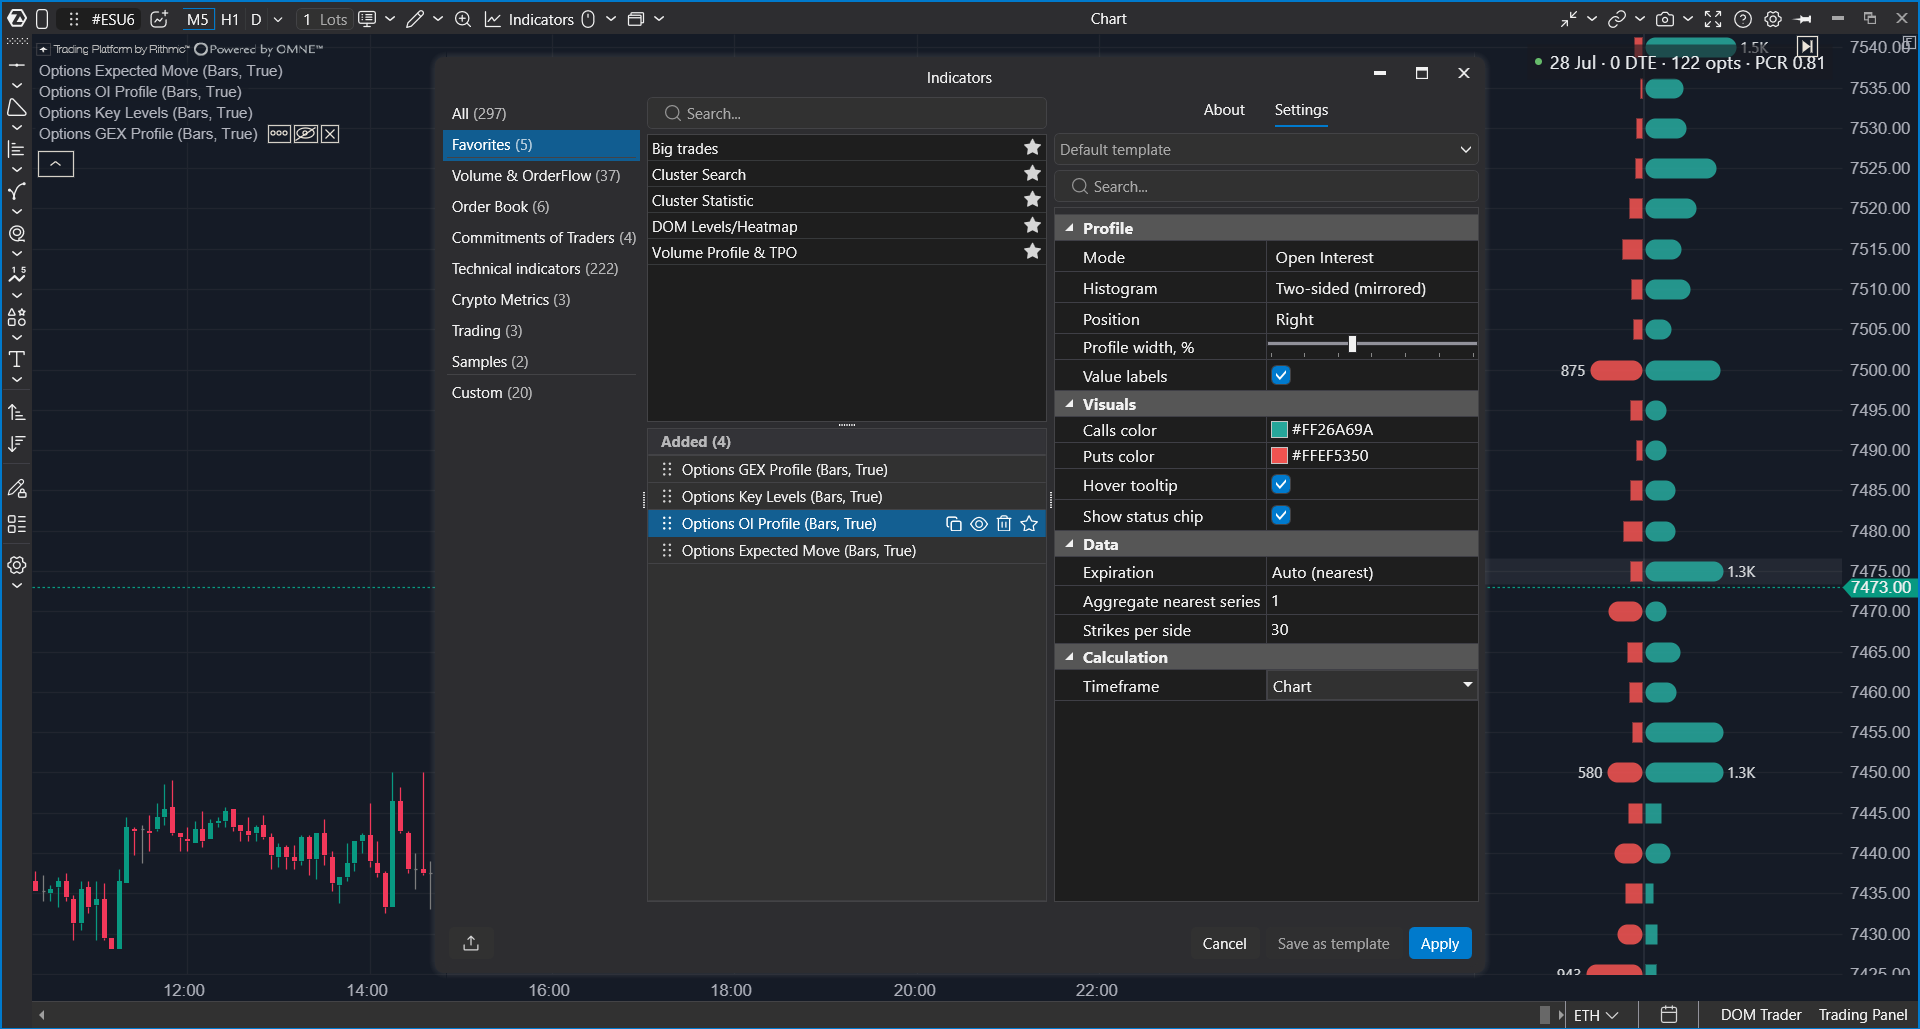
| Group | Setting | Description |
|---|---|---|
| Data | Expiration, Aggregate nearest series, Strikes per side, Wide range | See the common Data settings. |
| Profile | Mode | Selects Open Interest, Day Volume, or Net OI. |
| Profile | Histogram | Two-sided (mirrored) shows calls and puts from a shared axis. One-sided shows bars from the chart edge. |
| Profile | Position | Places the profile on the right or left side of the chart. |
| Profile | Profile width, % | Controls how much chart space the profile uses. |
| Profile | Value labels | Shows labels for the largest strikes. |
| Visuals | Colors, tooltip, status chip | Controls call and put colors, hover tooltip visibility, and the status chip. |
Practical notes
- Use Open Interest to identify larger structural positions.
- Use Day Volume for 0DTE and intraday analysis.
- Open interest can update less frequently than price or day volume, so abrupt changes are not expected on every tick.
Options Key Levels
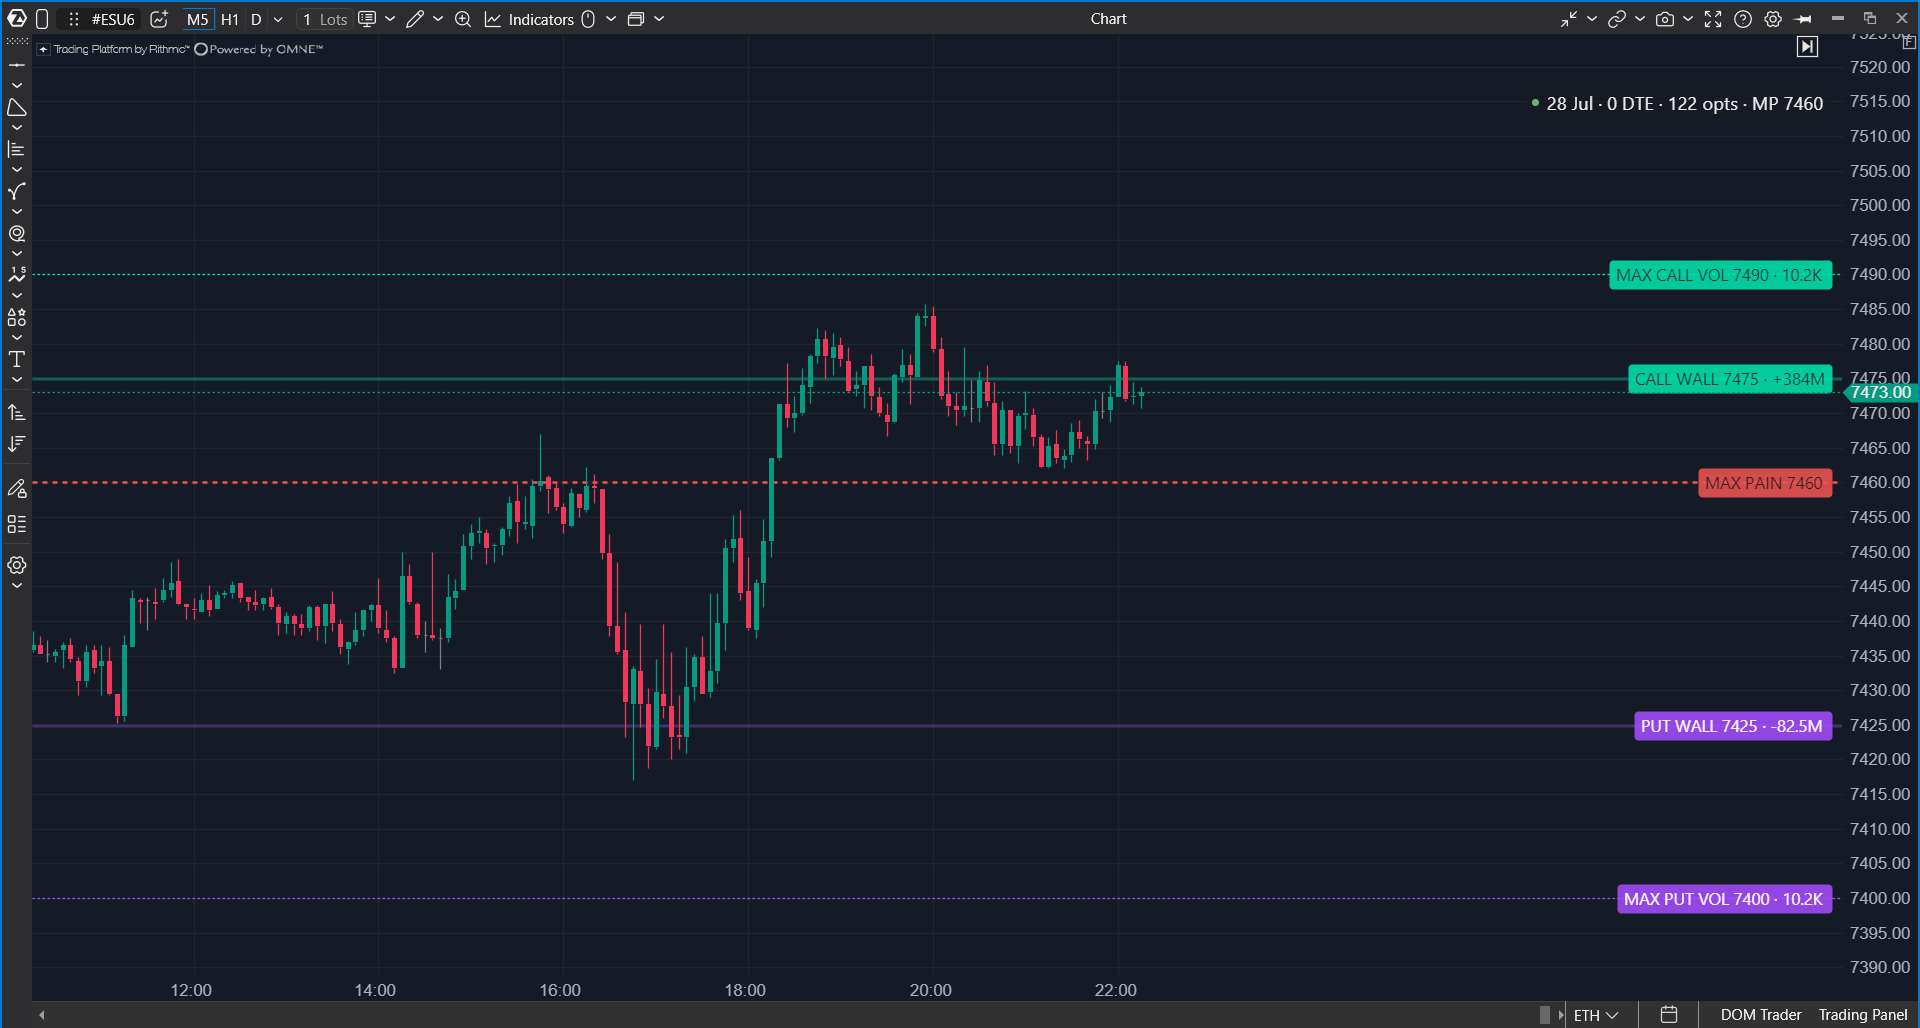
Options Key Levels calculates important option-based levels and draws them as horizontal lines on the chart.
What it shows
- MAX PAIN is the price where the largest amount of option premium would expire worthless.
- CALL WALL is a strike with strong call-side exposure above the market and can act as a resistance candidate.
- PUT WALL is a strike with strong put-side exposure below the market and can act as a support or acceleration candidate.
- Volume levels optionally show strikes with the largest day volume.
Why it is useful
The indicator gives ready-to-use support and resistance candidates calculated from options data. These levels can be especially useful near expiration, when options positioning may have a stronger effect on price behavior.
How it works
Max Pain is calculated by checking candidate strikes and estimating where the total payout to option holders would be the lowest at expiration.
Call Wall and Put Wall are calculated from option mass weighted by gamma and proximity to the current price. The same wall definition is used across the package, so Key Levels and GEX Profile should identify the same key strikes when they use the same settings.
Level labels automatically move apart when they overlap. Hovering over a level shows an explanatory tooltip.
Settings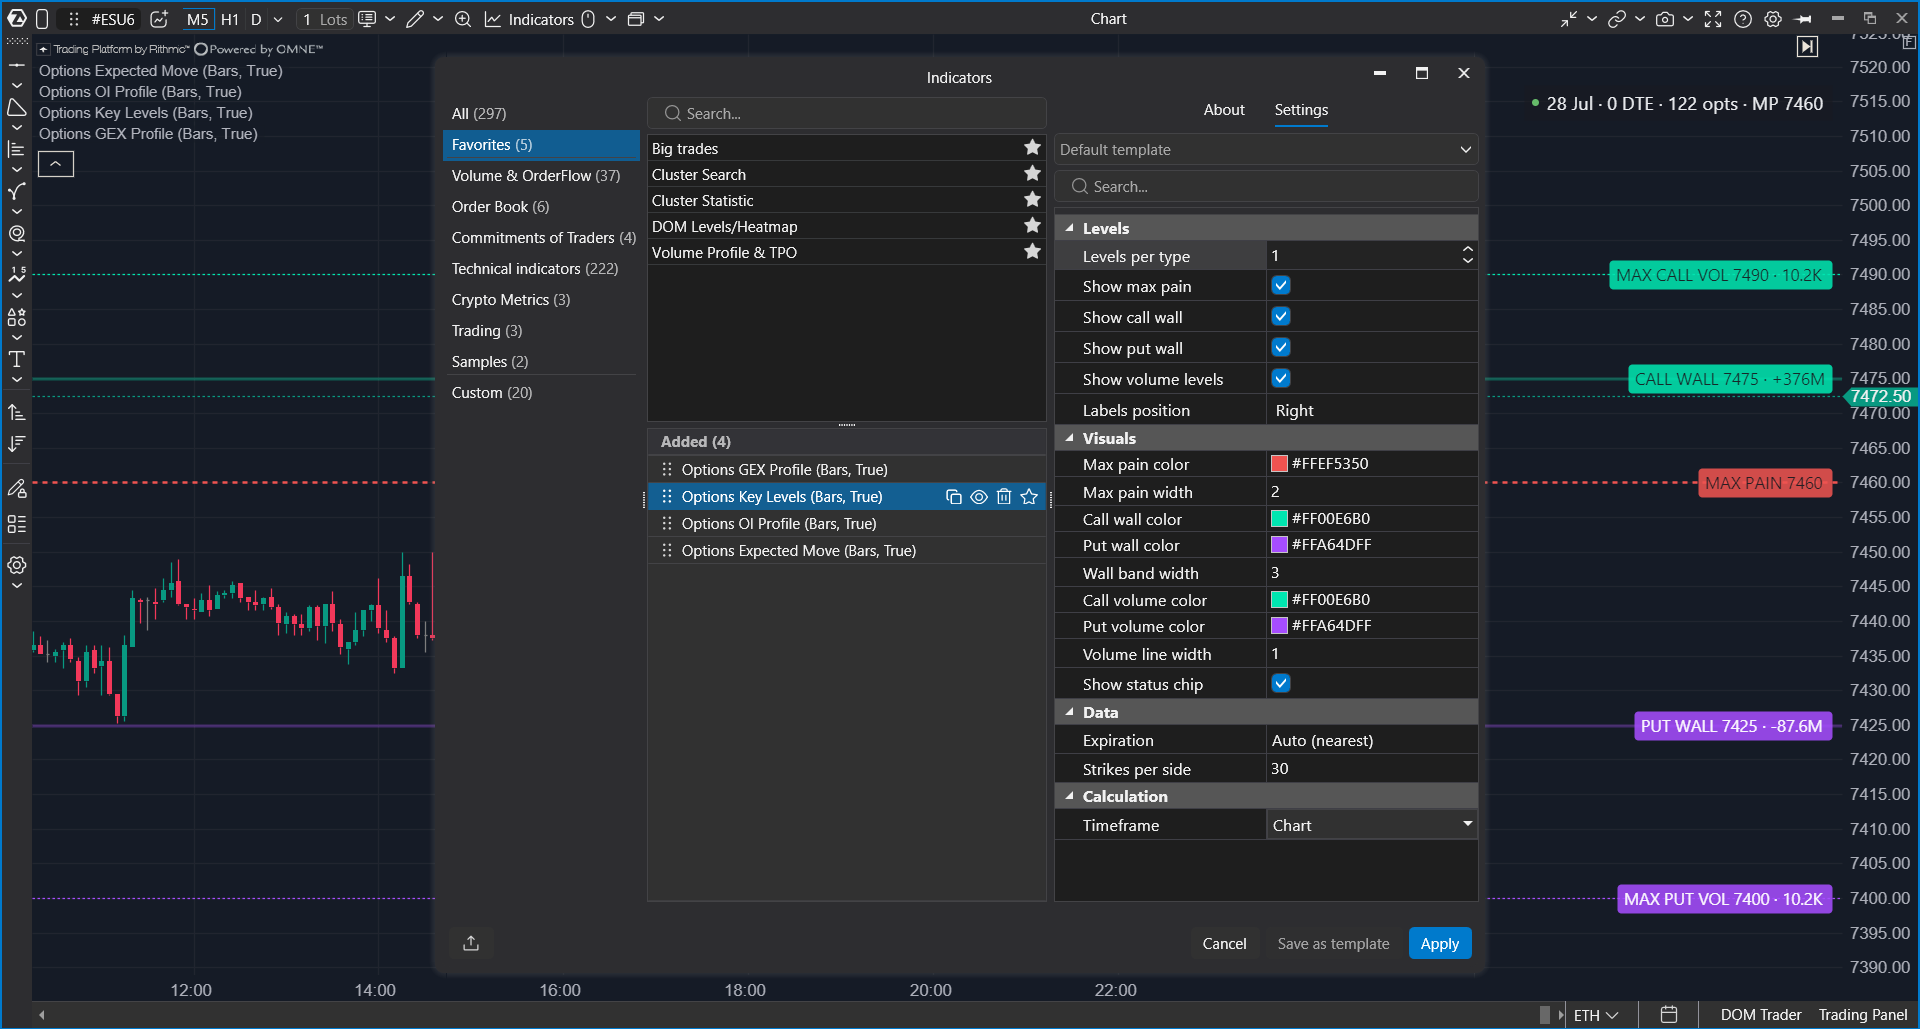
| Group | Setting | Description |
|---|---|---|
| Data | Expiration, Strikes per side | Defines the analyzed expiration and strike range. This indicator works with one expiration series because Max Pain from different expirations should not be merged. |
| Levels | Levels per type | Defines how many top levels of each type are shown. |
| Levels | Show max pain | Shows or hides the Max Pain line. |
| Levels | Show call wall | Shows or hides Call Wall levels. |
| Levels | Show put wall | Shows or hides Put Wall levels. |
| Levels | Show volume levels | Shows or hides strikes with the largest day volume. |
| Levels | Labels position | Controls where labels are placed: right, left, or center. |
| Visuals | Colors and line width | Controls the colors and thickness of Max Pain, wall, and volume lines. |
Practical notes
- The value in a wall label shows the strength of the level. Larger values usually indicate more important levels.
- Levels recalculate as the option chain updates.
- The calculation uses the subscribed strike range, so strikes outside this range are not included.
Options Expected Move
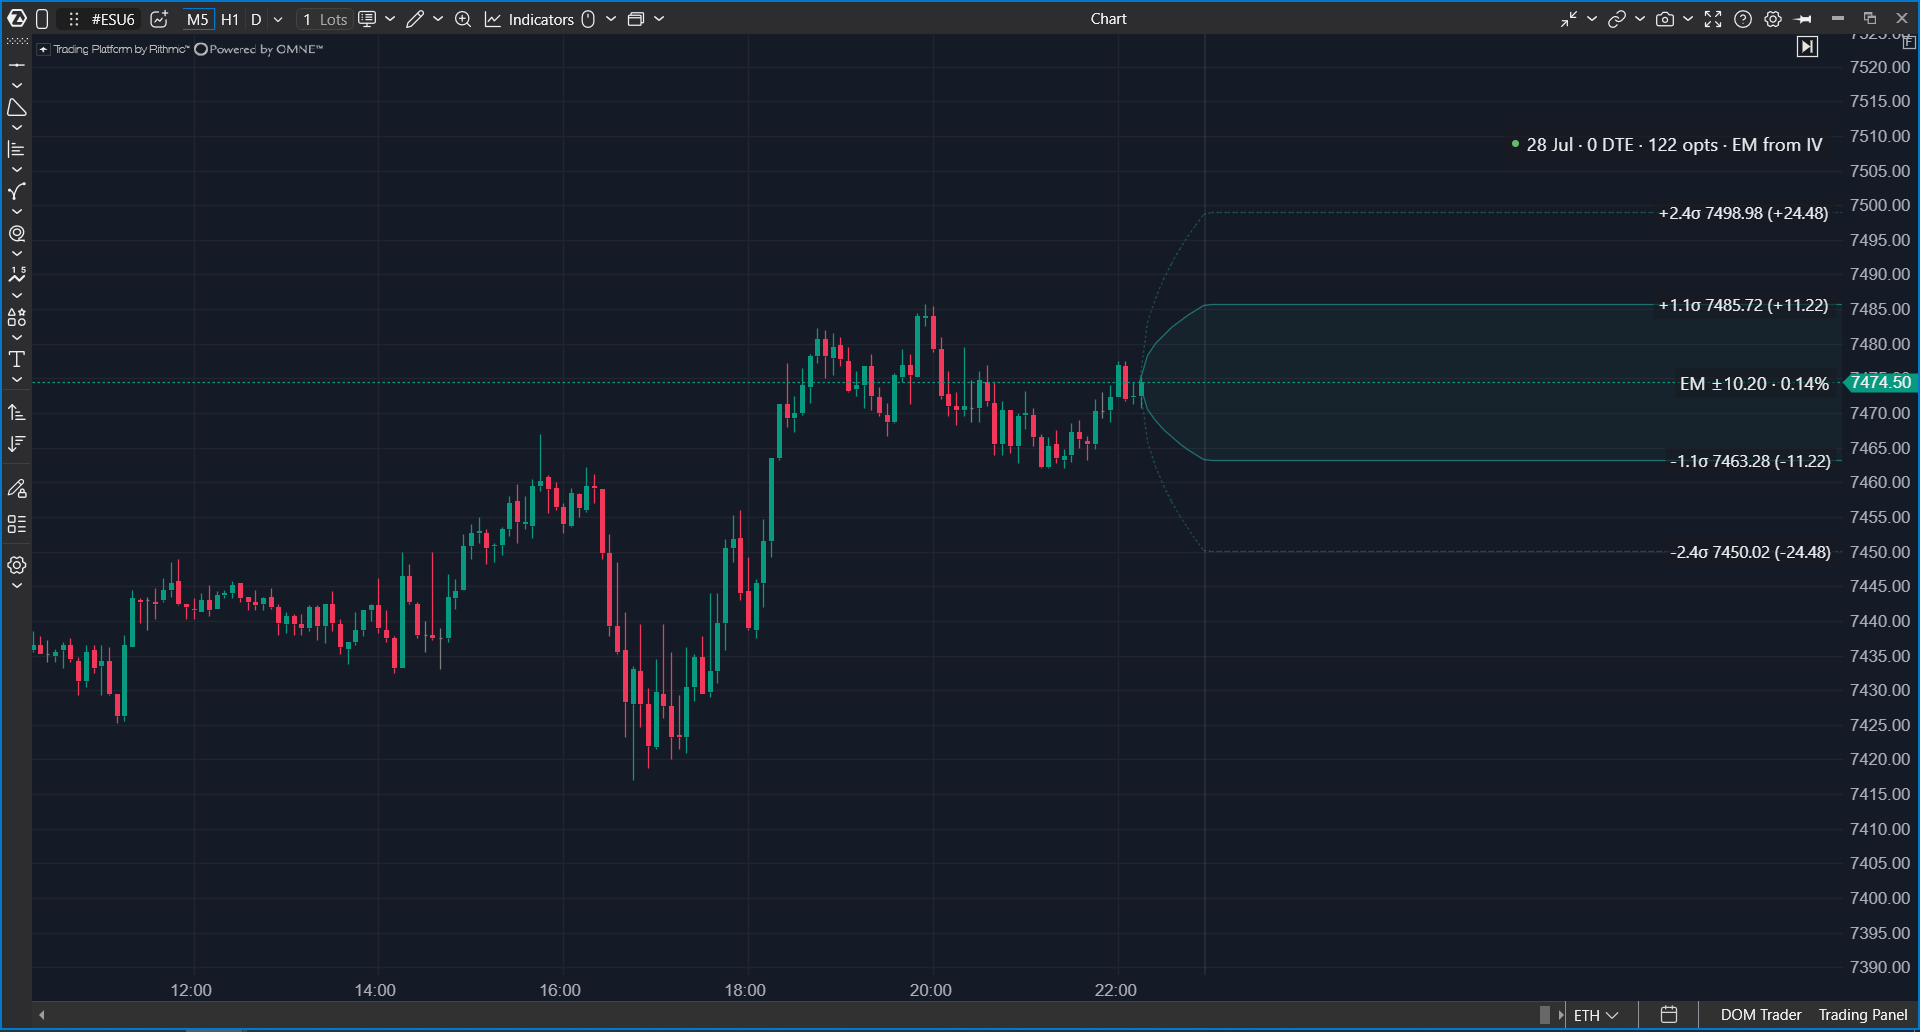
Options Expected Move shows the range that the options market is pricing for the selected expiration.
What it shows
The indicator draws an expanding cone or a corridor around the current price. The inner boundaries usually represent approximately one standard deviation, and the outer boundaries represent a wider two-standard-deviation range.
The expiration moment is marked on the chart. At that point, the cone reaches its full expected move size.
Why it is useful
Expected Move is based on what market participants are paying for in option prices. It helps estimate whether a potential target is inside or outside the movement range implied by the options market.
It can also help evaluate whether a move is already large relative to the market's priced expectations.
How it works
The indicator derives implied volatility from live option quotes around the current price and calculates the expected move for the remaining time until expiration. If implied volatility is not available, the indicator can use a fallback calculation based on the ATM straddle price.
The cone expands with time because price uncertainty grows as expiration gets farther away. For 0DTE options, the cone is usually more compact and changes during the session as time to expiration decreases.
Settings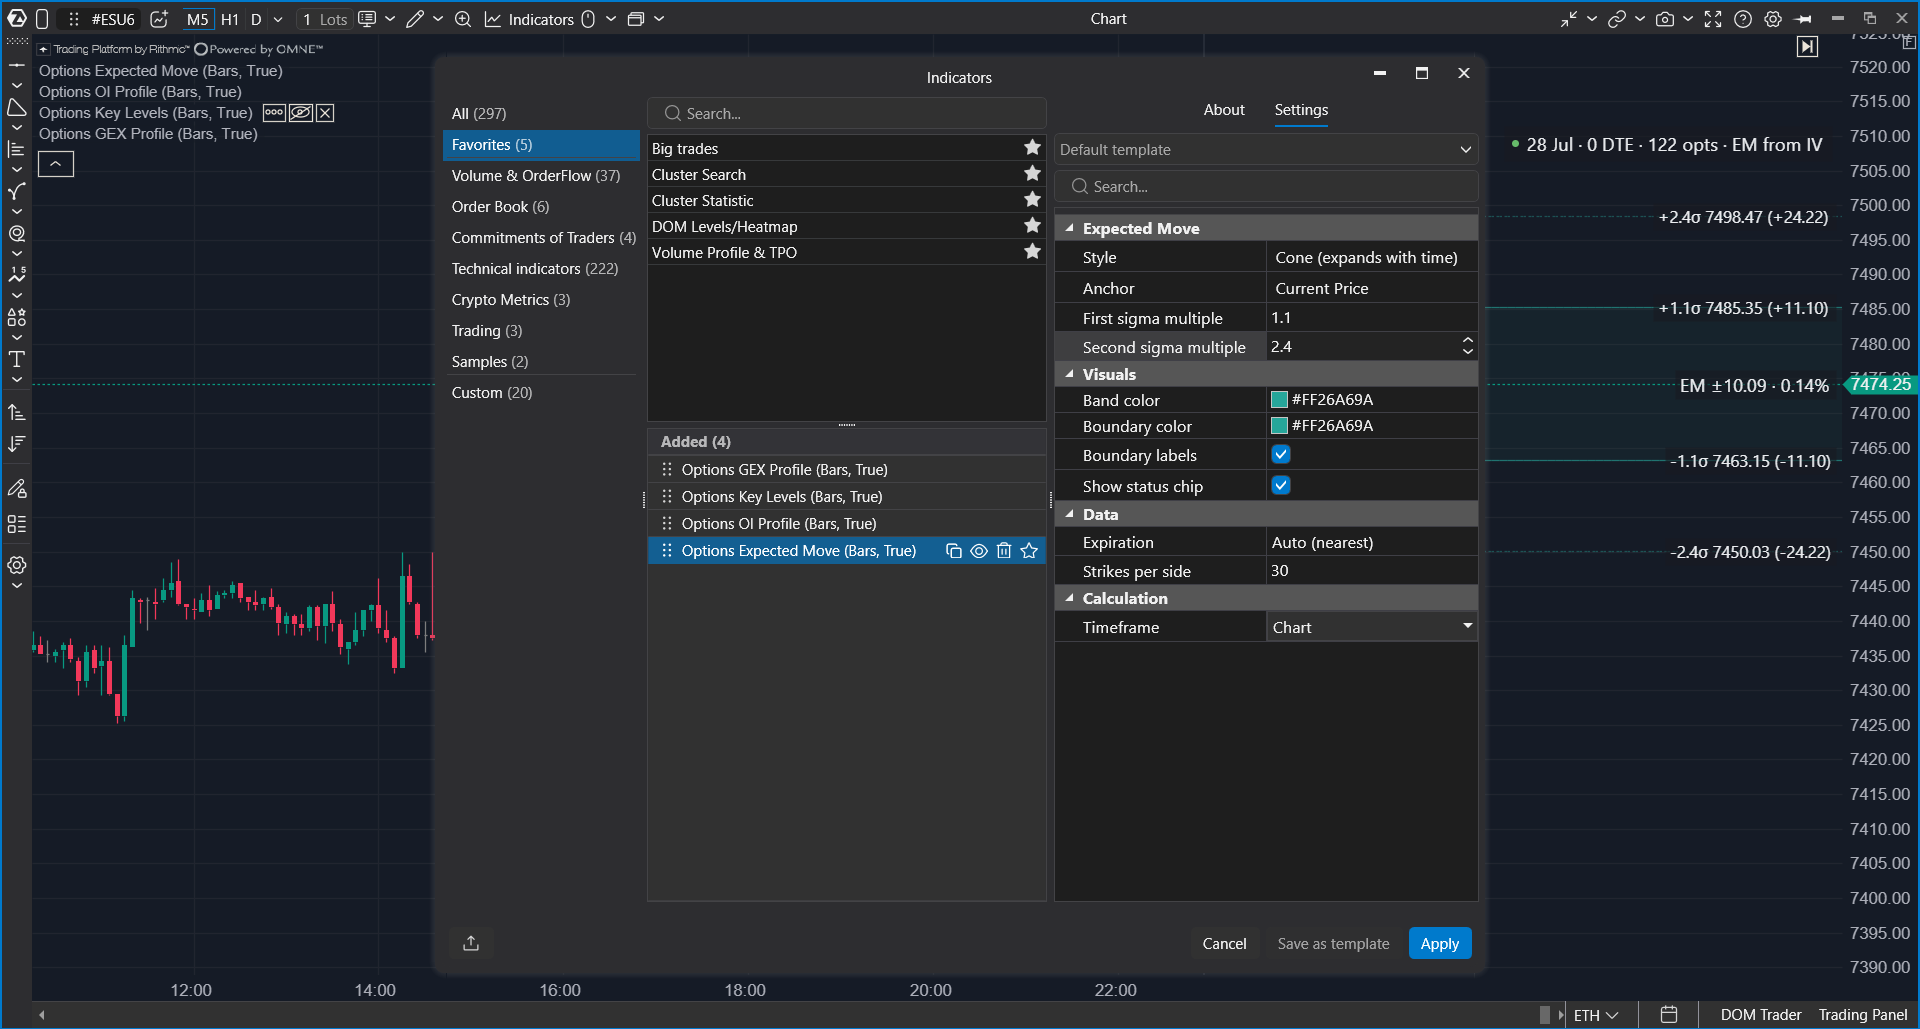
| Group | Setting | Description |
|---|---|---|
| Data | Expiration, Strikes per side | Defines the analyzed expiration and strike range. |
| Expected Move | Style | Cone draws an expanding expected move range. Corridor draws a flat range for the full expected move. |
| Expected Move | Anchor | Current Price follows the current price. Attachment Price keeps the range anchored to the price at the moment the indicator was added. |
| Expected Move | First sigma multiple | Controls the inner boundary multiplier. |
| Expected Move | Second sigma multiple | Controls the outer boundary multiplier. |
| Visuals | Band color, boundary color, labels | Controls the color of the expected move area, boundary lines, and boundary labels. |
Practical notes
- Boundary labels show the expected move range at the right edge of the visible chart.
- The status chip can show whether the value was calculated from implied volatility or from the straddle fallback.
- Daily expected move values from external services can be wider because they may refer to a full trading day, while the chart cone reflects the remaining time to expiration.
Options GEX Profile
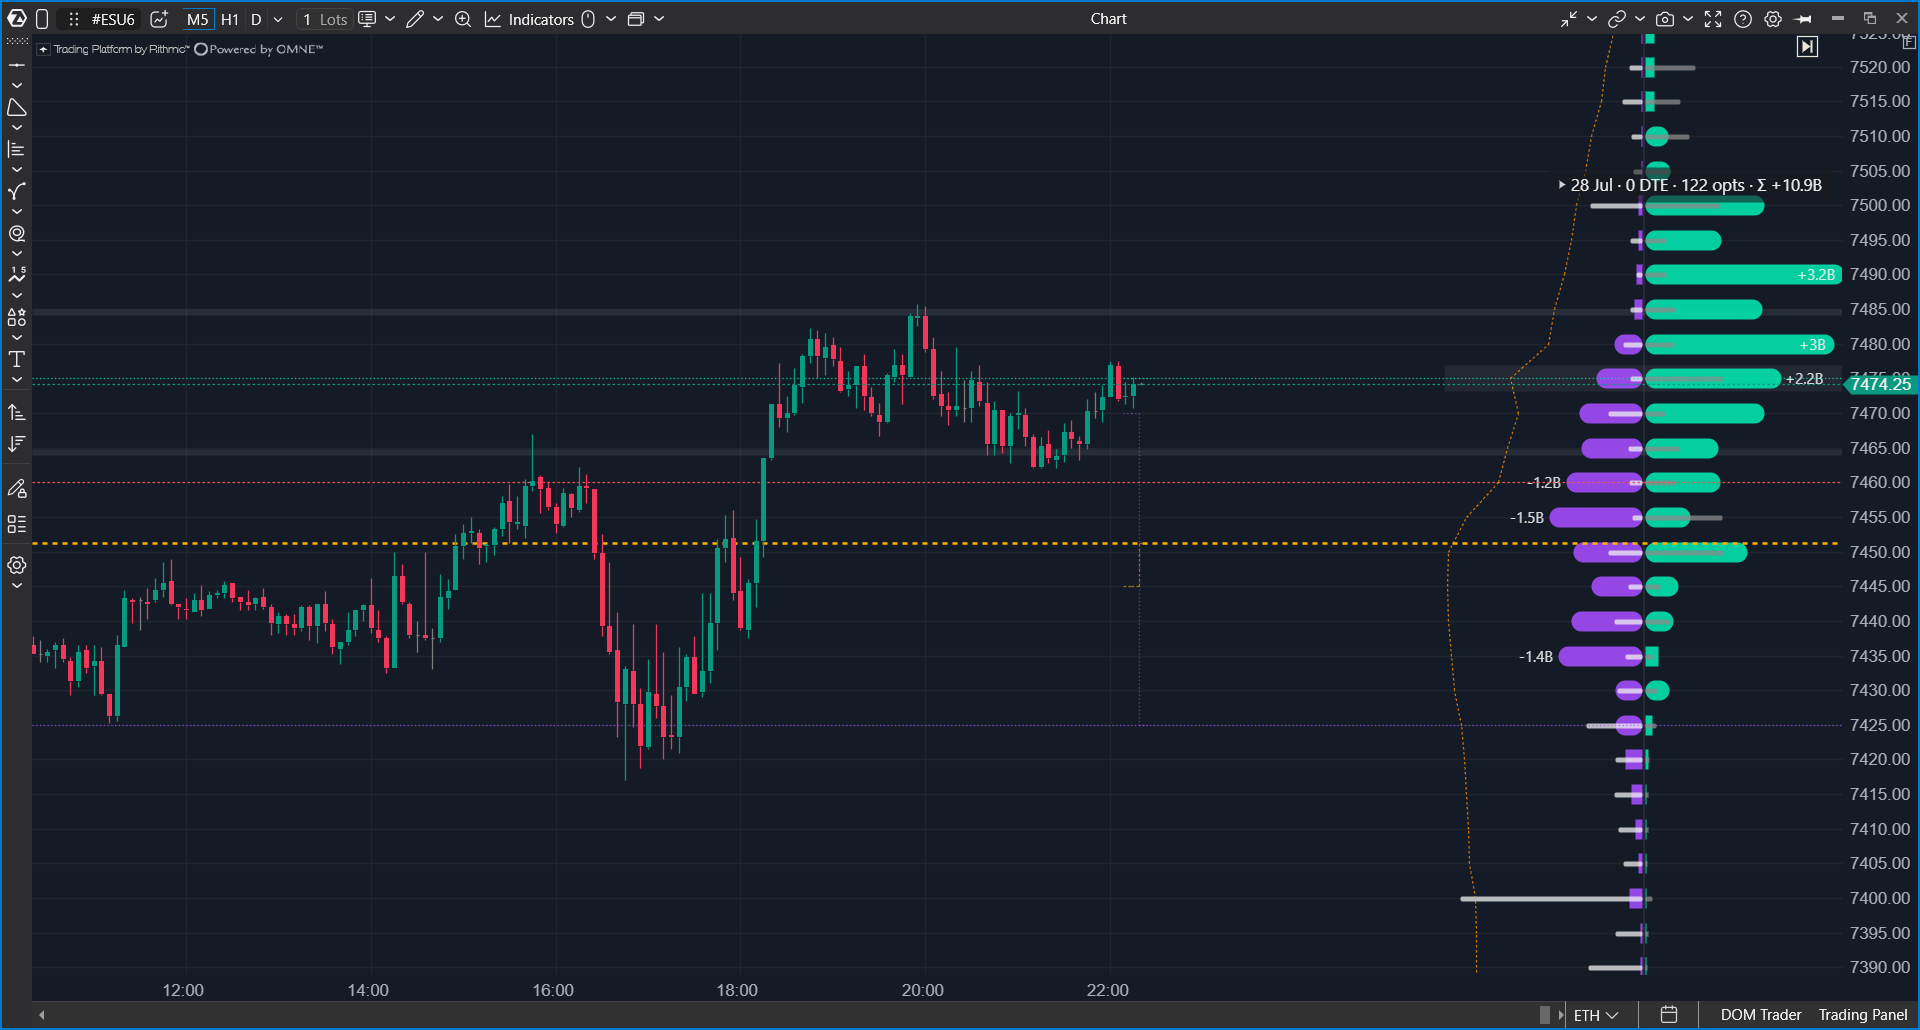
Options GEX Profile shows gamma exposure by strike and highlights areas where market-maker hedging may dampen or amplify price movement.
What it shows
The indicator displays a gamma exposure profile by strike. Positive gamma is shown on one side of the axis, and negative gamma is shown on the other side. The profile can also include key levels such as Zero Gamma, walls, Max Pain, Expected Move zones, and a cumulative line.
Why it is useful
Gamma exposure helps describe the market regime. In a positive gamma environment, hedging activity can dampen price movement because hedgers often trade against the move. In a negative gamma environment, hedging activity can amplify movement because hedgers may trade in the direction of the move.
Zero Gamma marks the area where the regime can change. Above it, range-bound behavior may be more likely. Below it, directional movement may become more active.
How it works
For each option contract, ATAS calculates gamma from live option data. The strike contribution is calculated from gamma, position size, contract multiplier, and underlying price. Calls and puts use the standard sign convention for gamma exposure.
The cumulative line shows how exposure accumulates across strikes. GEX Profile and Options Key Levels use consistent level logic, so their walls should match when the same input settings are used.
Interactive legend
The indicator can show an interactive legend on the chart. Depending on the configuration, it can be used to switch histogram view, source, and overlay visibility.
- Split / Net switches between separate call and put bars and a net profile.
- Vol / OI switches between volume-based and open interest-based source modes.
- Overlay rows can show or hide Zero Gamma, walls, Max Pain, cumulative line, levels history, OI underlay, and Expected Move zones.
- Hovering over a level or profile row shows a tooltip with detailed values.
Key elements
| Element | Meaning |
|---|---|
| Zero Gamma | The area where the gamma regime changes. A break through this level can change the character of the session. |
| GEX bars | Gamma exposure strength by strike, displayed in dollars per 1% underlying move. |
| Walls | Strikes with the strongest positive or negative exposure. |
| OI underlay | Open interest context shown under or over the GEX bars. |
| Cumulative GEX | A cumulative exposure line across strikes. |
| Levels history | Shows how Zero Gamma and wall levels moved during the session after the indicator was added. |
| Expected Move zones | Shows the expected move area together with the GEX profile. |
Settings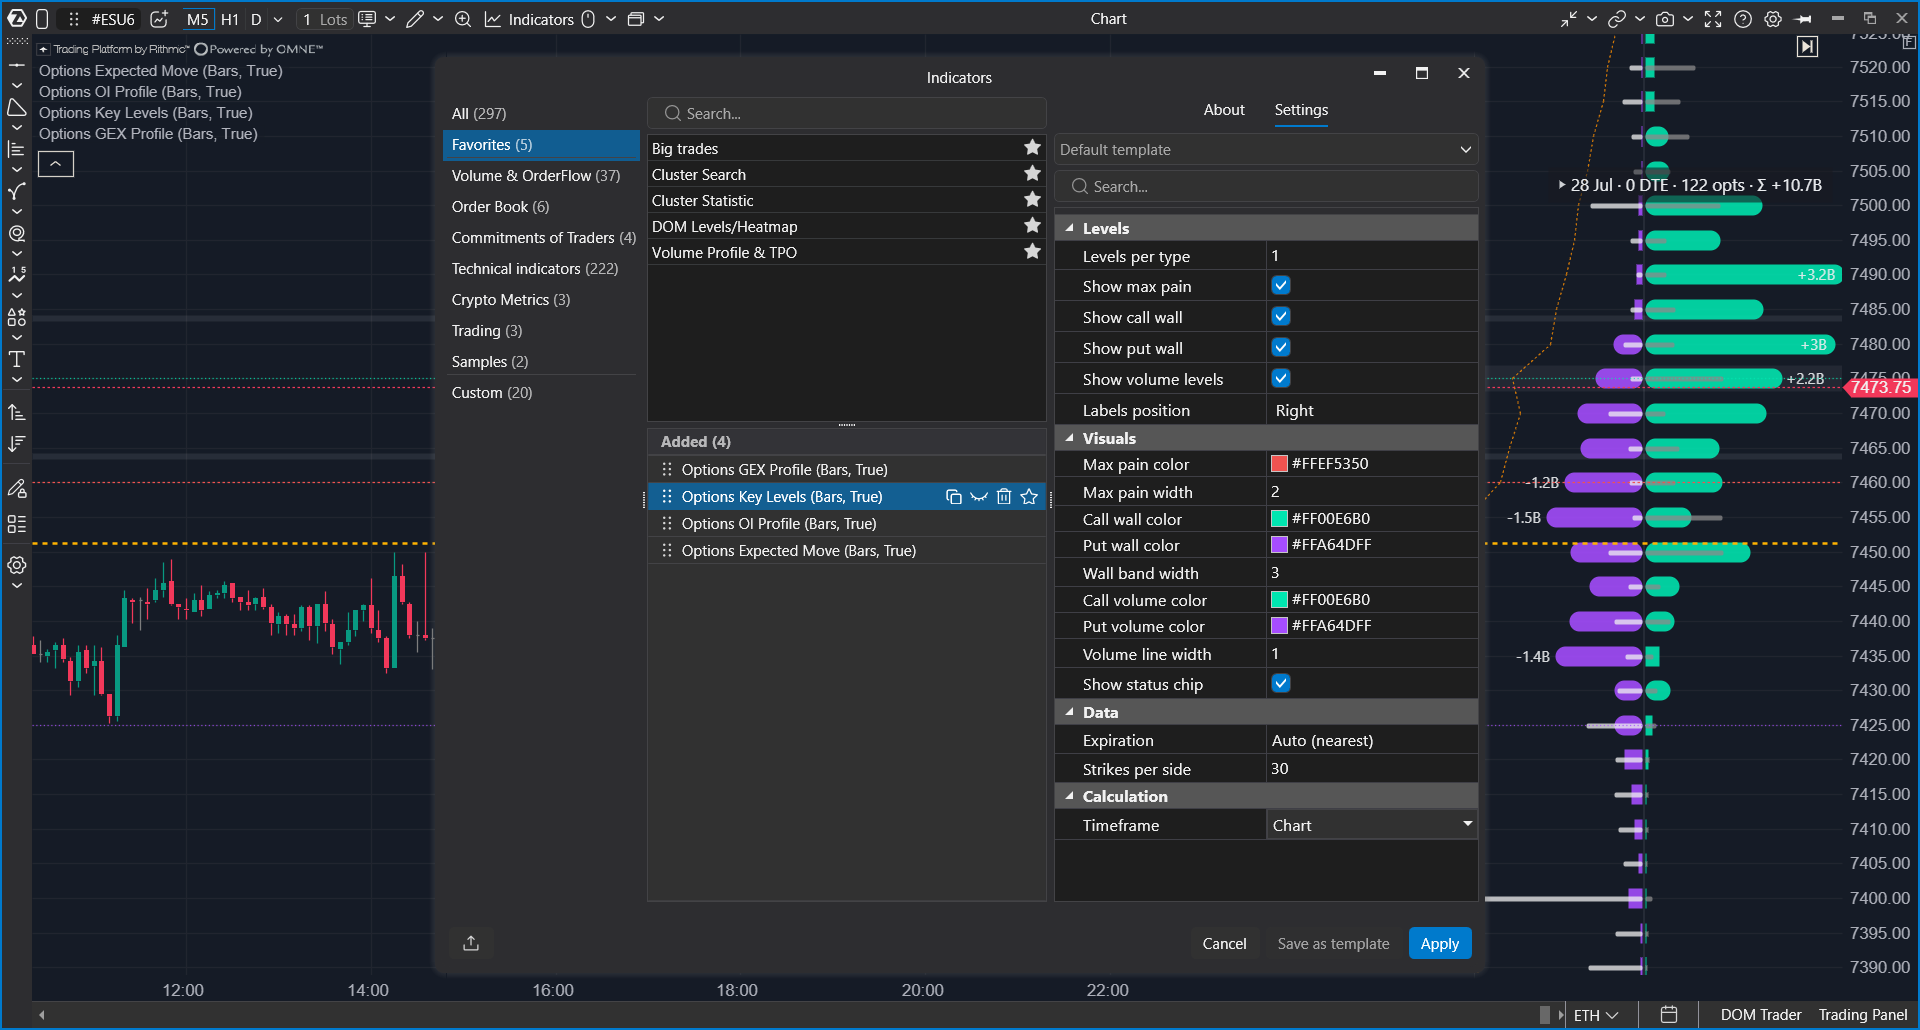
| Group | Setting | Description |
|---|---|---|
| Data | Expiration, Aggregate nearest series, Strikes per side, Wide range | See the common Data settings. |
| GEX | Source | Day Volume calculates gamma exposure from current session volume. Open Interest uses accumulated positions. |
| GEX | Histogram | Split shows calls and puts separately. Net shows one net bar per strike. |
| GEX | Walls per side | Defines how many walls are highlighted on each side. |
| GEX | Wall labels | Shows compact labels with wall values. |
| Overlays | Total gamma curve, Cumulative GEX, Levels history, OI underlay, Max Pain line, Expected Move zones | Controls which additional elements are drawn over the GEX profile. |
| Profile | Position and Profile width, % | Controls the side and width of the profile. |
| Visuals | Colors, tooltip, status chip | Controls positive and negative GEX colors, Zero Gamma, Max Pain, call/put OI colors, tooltip, and status chip. |
Practical notes
- The tooltip can show net GEX by strike, open interest, implied volatility, and additional values for calls and puts.
- Gamma exposure is an analytical model of likely market-maker hedging behavior. It is not a direct view of any participant's actual book and should not be treated as a trade signal by itself.
- Zero Gamma can move during the session as option prices, volatility, and volume change.
Frequently asked questions
Why does the indicator need time to warm up?
The indicator has to subscribe to multiple option contracts and collect enough quotes for the selected strike and expiration range. This usually takes a short time after the indicator is added to the chart.
Why do values differ from other services?
Different tools may use different data sources, expiration filters, strike ranges, open interest update timing, implied volatility methods, or index-to-futures mapping rules. Always compare the selected inputs before comparing final levels.
Why does the picture start from the moment the indicator was added?
The indicator works with currently available options data. Some intraday visuals start collecting data after they are added to the chart, so they may not reconstruct everything that happened earlier in the session.
What should I check if the indicator shows no data?
Check that your connection provides options data for the selected underlying instrument, that the required market data subscription is active, and that the selected expiration range contains available option contracts.
Related articles
Was this article helpful?
That’s Great!
Thank you for your feedback
Sorry! We couldn't be helpful
Thank you for your feedback
Feedback sent
We appreciate your effort and will try to fix the article