Delta Divergence Widget — User Guide
Delta Divergence is a widget for tracking divergences between price movement and changes in delta (the balance between buying and selling) in real time.
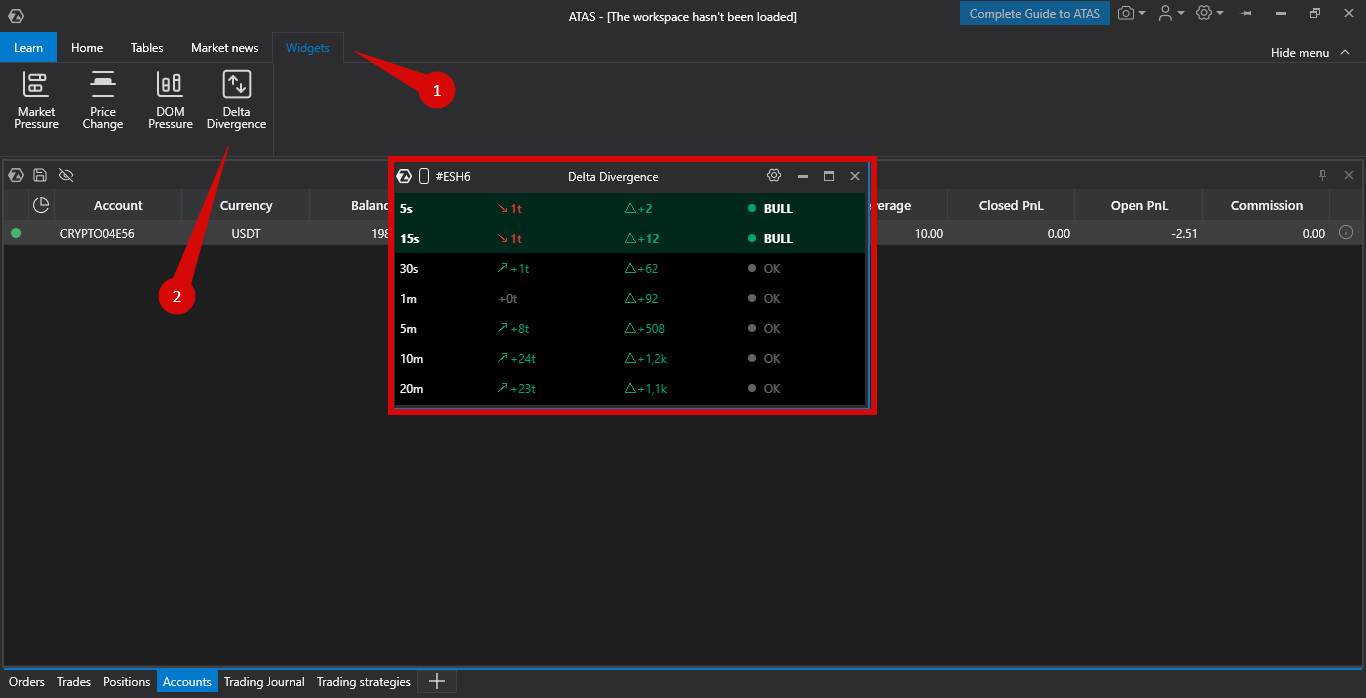
Table of Contents
- What is Delta Divergence
- How It Works
- Widget Interface
- Types of Divergences
- Settings
- How to Use
- Trading Scenario Examples
- Frequently Asked Questions
- Conclusion
What is Delta Divergence
Core Idea
When price rises, it is usually confirmed by buying activity (positive delta). If price rises while delta decreases, this signals weakening buying pressure and a possible reversal or correction. The widget automatically detects such situations across multiple timeframes simultaneously.
Key Advantages
- Instant detection — the widget analyzes every tick in real time.
- Multiple timeframes — from 5 seconds to 20 minutes.
- Visual clarity — color coding for quick analysis.
- Divergence duration — shows how long the divergence has been active.
How It Works
Divergence Calculation
The widget uses a sliding window for each timeframe:
- Tracks ticks within a specific time window (for example, the last 30 seconds).
- Calculates price change = last tick price − first tick price in the window (in ticks).
- Calculates delta change= sum of all deltas within the window:
- Buys (Buy) = positive delta.
- Sells (Sell) = negative delta.
- Determines the divergence type based on movement direction.
Widget Interface
Main View
┌────────────────────────────────────────┐
│ 5s   ↗ +5t   Δ +250    ? OK          │  ← No divergence
│ 15s  ↗ +12t  Δ -150    ? BEAR 15s    │  ← Bearish divergence
│ 30s  ↘ -8t   Δ +320    ? BULL 45s    │  ← Bullish divergence
│ 1m   ↗ +15t  Δ +500    ? OK          │  ← No divergence
│ 5m   ↗ +45t  Δ +1.5k   ? OK          │  ← No divergence
│ 10m  ↗ +80t  Δ -2.3k   ? BEAR 2m 15s │  ← Bearish 2 min 15 sec
│ 20m  ↘ -120t Δ +5.2k   ? BULL 5m     │  ← Bullish 5 minutes
└────────────────────────────────────────┘
Types of Divergences
? SYNC (OK) — Synchronized Movement
Condition: price and delta move in the same direction.
| Scenario | Price | Delta | Interpretation |
| Healthy growth | ↗ +10t | Δ +500 | Growth supported by buying ✅ |
| Healthy decline | ↘ -10t | Δ -500 | Decline supported by selling ✅ |
| Consolidation | 0 | any | No price movement |
| Flat | any | 0 | No activity |
Visually: no background, status OK displayed in gray.
? BEAR — Bearish Divergence
Condition: price rises ↗, but delta falls ↘.
Price:  ? +15 ticks
Delta: ? -300
       ─────────────
Result: BEAR (bearish signal)
What it means:
- Price is rising but buyers are weakening.
- Sellers begin to dominate.
- A downward reversal or correction may occur soon.
Trading interpretation:
- ⚠️ Be cautious with long positions at this level.
- ? Possible short opportunity (especially if seen on multiple timeframes).
- ? Buyer weakness — the rally may not continue.
Visually: red background, status BEAR + divergence duration.
Example:
20m ↗ +50t Δ -1.5k ? BEAR 3m 20s
Price increased by 50 ticks in 20 minutes, but delta is negative −1500, and the divergence has lasted for 3 minutes and 20 seconds.
? BULL — Bullish Divergence
Condition: price falls ↘, but delta rises ↗.
Price:  ? -12 ticks
Delta: ? +400
       ─────────────
Result: BULL (bullish signal)
What it means:
- Price is falling but buyers remain active.
- Buyers begin to dominate.
- An upward reversal or the end of a correction may occur soon.
Trading interpretation:
- ? Possible long opportunity (especially across multiple timeframes).
- ⚠️ Be cautious with shorts — the decline may stop.
- ? Buyer strength — willingness to buy during declines.
Visually: green background, status BULL + divergence duration.
Example:
1m ↘ -8t Δ +250 ? BULL 45s
Price dropped by 8 ticks in 1 minute, but delta is positive at +250, and the divergence has lasted for 45 seconds.
Settings
Timeframes
You can enable or disable the display of each timeframe:
| Setting | Timeframe | Usage |
| Show 5 Seconds | 5 seconds | Scalping, high-frequency trading |
| Show 15 Seconds | 15 seconds | Short-term movements |
| Show 30 Seconds | 30 seconds | Intraminute reversals |
| Show 1 Minute | 1 minute | Fast trading |
| Show 5 Minutes | 5 minutes | Medium-term signals |
| Show 10 Minutes | 10 minutes | Swing trading |
| Show 20 Minutes | 20 minutes | Longer-term reversals |
Recommendation:
- For scalping keep: 5s, 15s, 30s, 1m.
- For day trading use: 1m, 5m, 10m.
- For swing trading use: 5m, 10m, 20m.
Colors
| Setting | Default | Purpose |
| Positive Color | Green (#00A572) | Price/delta increase, bullish signals |
| Negative Color | Red (#D53930) | Price/delta decrease, bearish signals |
| Text Color | White | Widget text |
| Background Color | Black | Widget background |
| Bear Divergence Color | Semi-transparent red | Bearish divergence background |
| Bull Divergence Color | Semi-transparent green | Bullish divergence background |
Customization tips:
- Adjust colors to match your platform theme.
- You can increase contrast for better visibility.
- Background transparency allows multiple widgets to remain visible.
How to Use
Basic Usage
1. Trend Confirmation
Scenario: you see price rising on the chart.
✅ Healthy growth:
5m   ↗ +30t  Δ +1.2k  ? OK
10m  ↗ +55t  Δ +2.8k  ? OK
→ Delta confirms the rise.
❌ Weak growth (divergence):
5m   ↗ +30t  Δ -500   ? BEAR 1m 30s
10m  ↗ +55t  Δ -1.2k  ? BEAR 3m
→ Growth is not supported by buying; a correction is possible.
2. Finding Entry Points
Example — long entry:
Price is correcting downward — we look for where buyers start returning:
Before (weakness):
1m   ↘ -5t   Δ -150   ? OK  (decline with selling)

After (divergence):
1m   ↘ -8t   Δ +200   ? BULL 20s  (buyers appeared!)
5m   ↘ -15t  Δ +850   ? BULL 1m
Action: prepare for a long position and wait for chart confirmation of the reversal.
Example — short entry:
Price is rising — we look for where sellers begin to dominate:
Before (strength):
1m   ↗ +6t   Δ +300   ? OK  (growth supported by buying)

After (divergence):
1m   ↗ +10t  Δ -250   ? BEAR 15s  (sellers appeared!)
5m   ↗ +25t  Δ -900   ? BEAR 45s
Action: prepare for a short position and look for a reversal pattern on the chart.
3. Filtering False Breakouts
Scenario: price breaks an important level upward.
Real breakout:
1m   ↗ +12t  Δ +600   ? OK  (buying supports the move)
5m   ↗ +30t  Δ +2.1k  ? OK
False breakout:
1m   ↗ +12t  Δ -200   ? BEAR 30s  (selling during growth!)
5m   ↗ +30t  Δ -500   ? BEAR 1m 15s
→ A pullback is likely.
Trading Scenario Examples
Advanced Strategies
Multi-Timeframe Analysis
Strong signal = divergence on multiple timeframes simultaneously.
Example of a strong bearish signal:
1m   ↗ +8t   Δ -150   ? BEAR 40s
5m   ↗ +20t  Δ -800   ? BEAR 2m 10s
10m  ↗ +35t  Δ -1.5k  ? BEAR 5m 30s
→ Three timeframes show bearish divergence = a strong signal for reversal or correction.
Time in Divergence
The longer a divergence lasts, the stronger the signal:
| Duration | Significance |
| < 30 sec | Weak signal, may be noise |
| 30 sec – 2 min | Medium signal, worth attention |
| > 2 min | Strong signal, high probability of movement |
Example:
5m ↗ +25t Δ -1.2k ? BEAR 4m 30s
The divergence has lasted for 4.5 minutes — this is a strong signal.
Frequently Asked Questions
Does the widget guarantee profit?
No. Delta Divergence is an analysis tool, not a “holy grail.” Use it together with other analytical methods and always manage risk.
How to choose timeframes for your trading style?
- Scalping: 5s, 15s, 30s, 1m.
- Day trading: 1m, 5m, 10m.
- Swing trading: 5m, 10m, 20m.
How to determine if a signal is strong?
A signal is usually stronger if:
- the divergence appears on multiple timeframes simultaneously;
- the divergence lasts a long time (for example, more than 2 minutes).
Conclusion
Delta Divergence is a powerful tool for analyzing the balance between buyers and sellers in real time. Proper use of the widget allows you to:
- ? Identify reversal points earlier.
- ? Confirm trend strength.
- ⚠️ Avoid false breakouts.
- ? Improve entry and exit accuracy.
Remember: this is an analysis tool, not a “holy grail.” Use it together with other analytical methods and always manage risk.
Was this article helpful?
That’s Great!
Thank you for your feedback
Sorry! We couldn't be helpful
Thank you for your feedback
Feedback sent
We appreciate your effort and will try to fix the article